This post was inspired by my Making Agents Work talk at Boston Code Camp #40, inspired by my OTel demo snafu at the live event.

Quoting from https://opentelemetry.io/ – “OpenTelemetry is an open source observability framework for cloud native software. It provides a single set of APIs, libraries, agents, and collector services to capture distributed traces and metrics from your application.”
Here we focus on Open Telemetry – or OTel for short – Traces.
The Anemic OTel Trace Antipattern
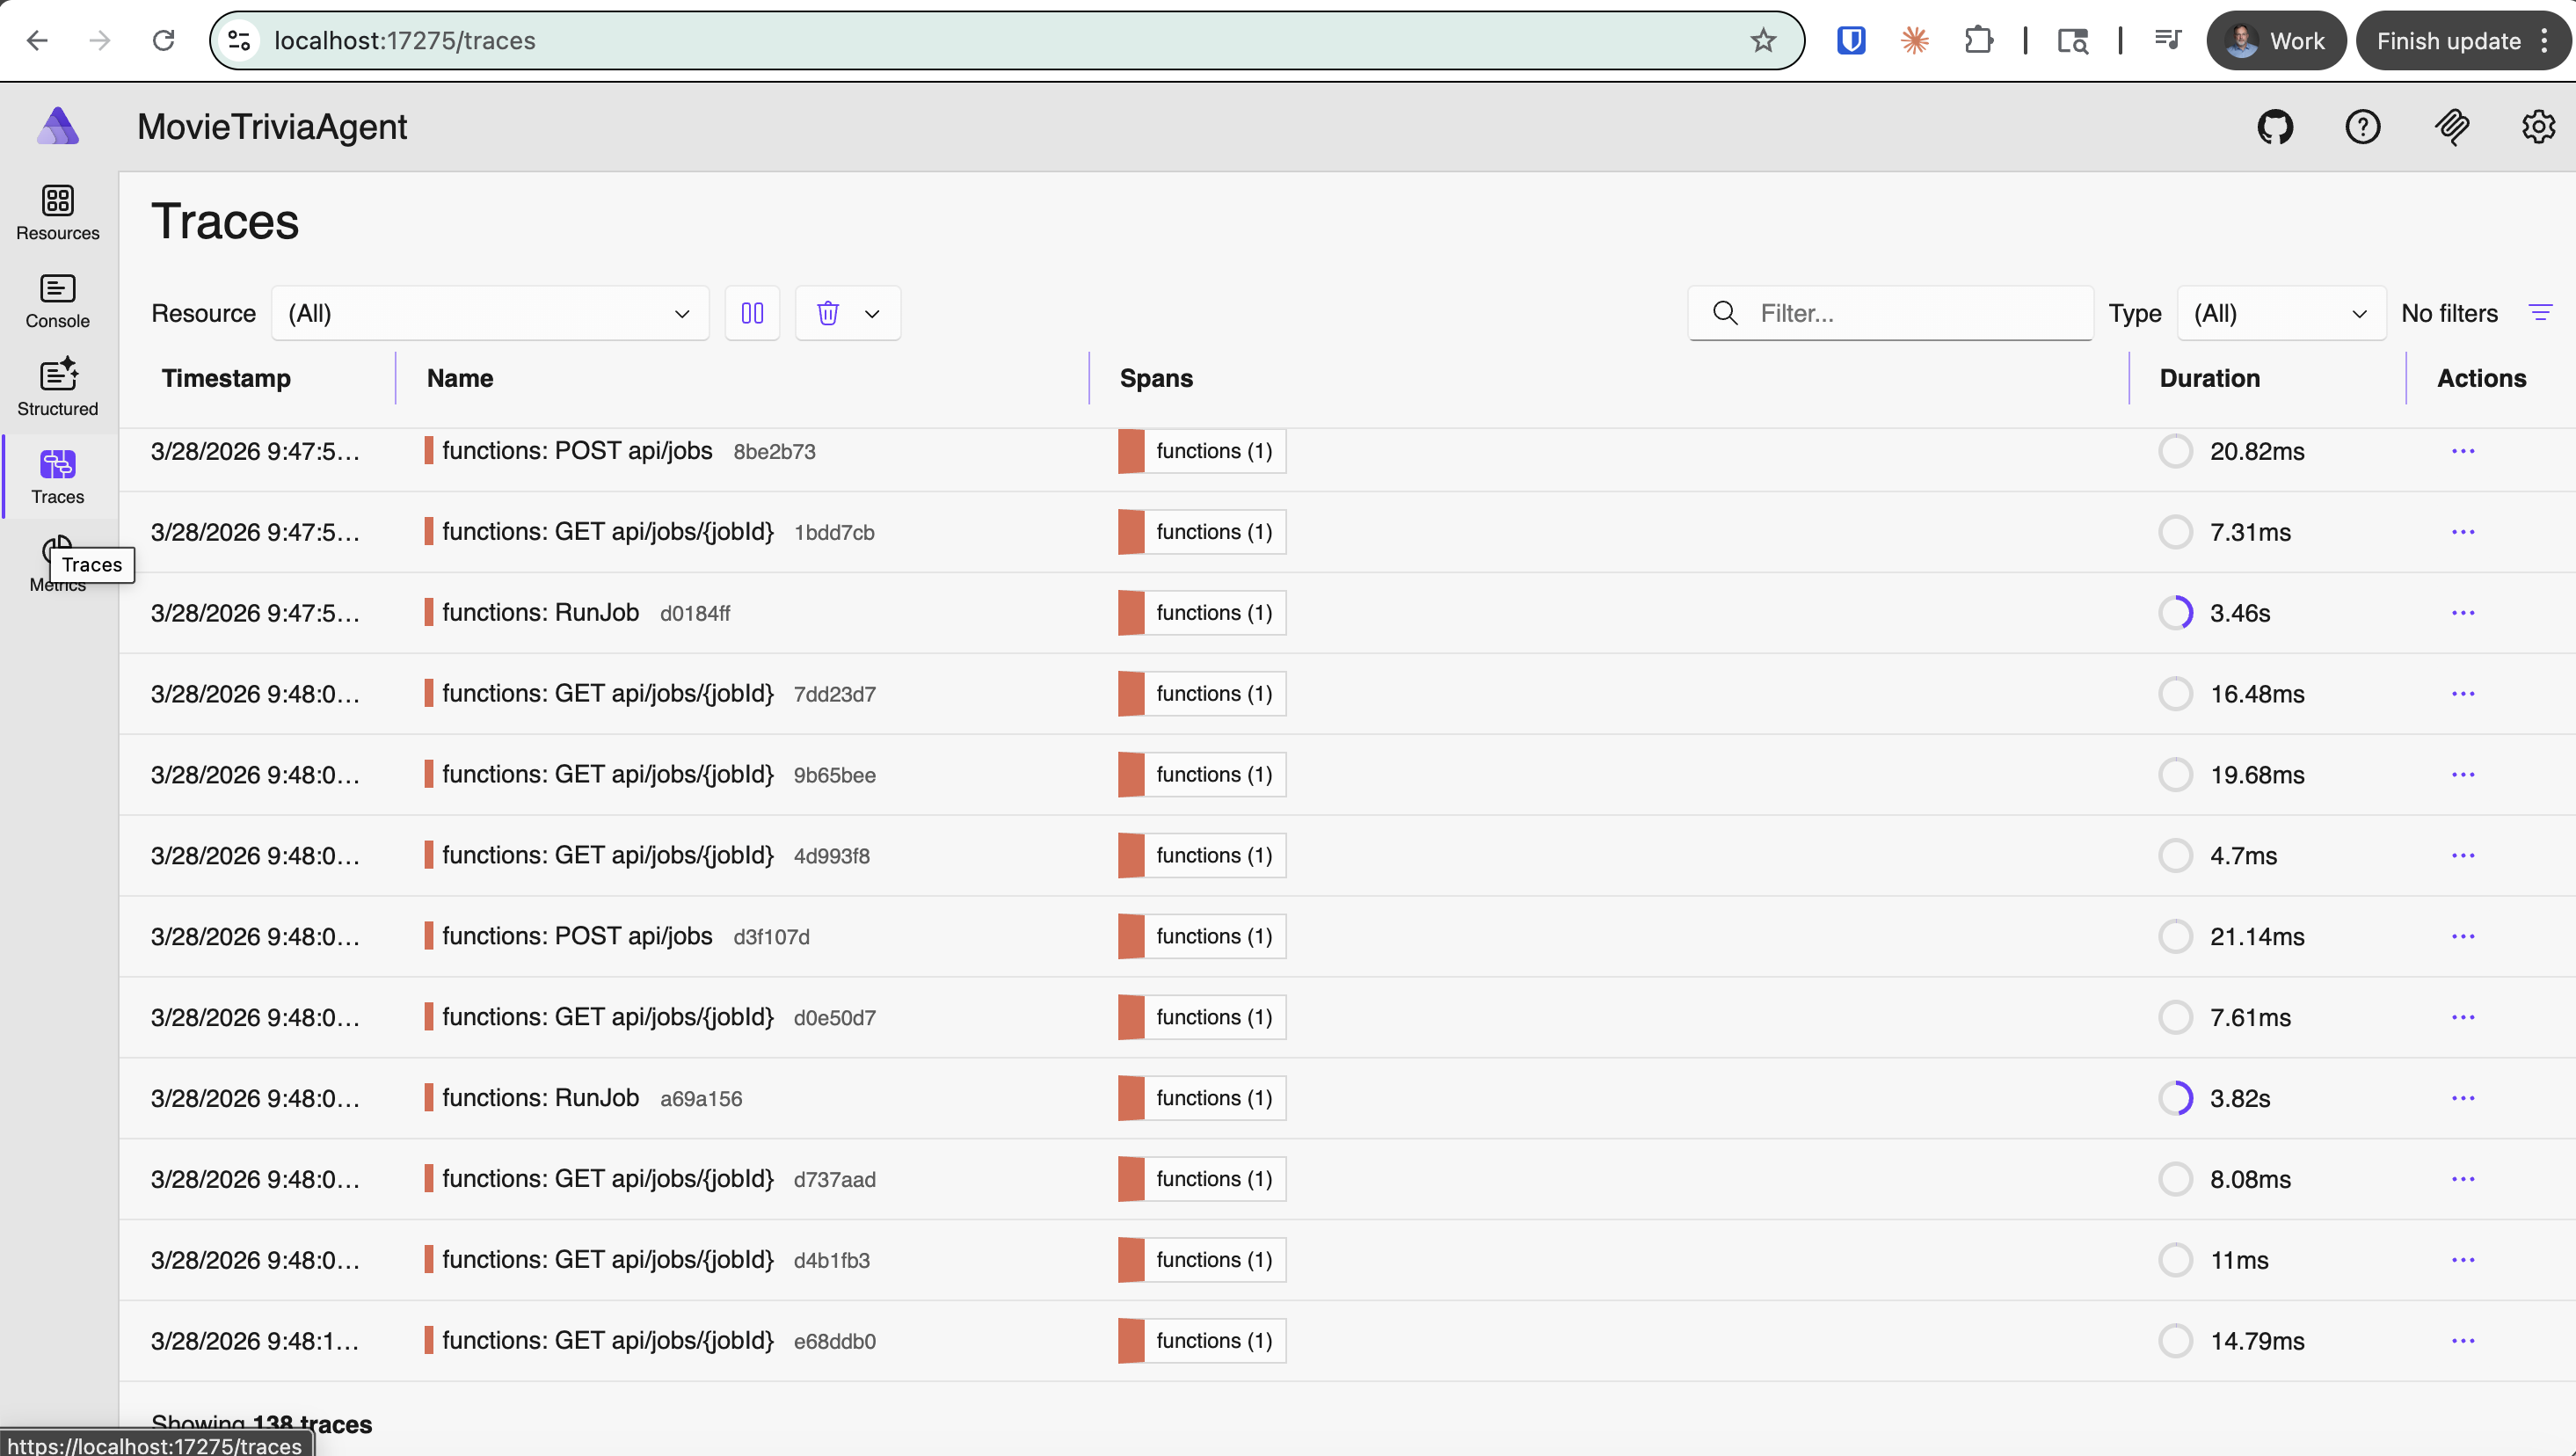
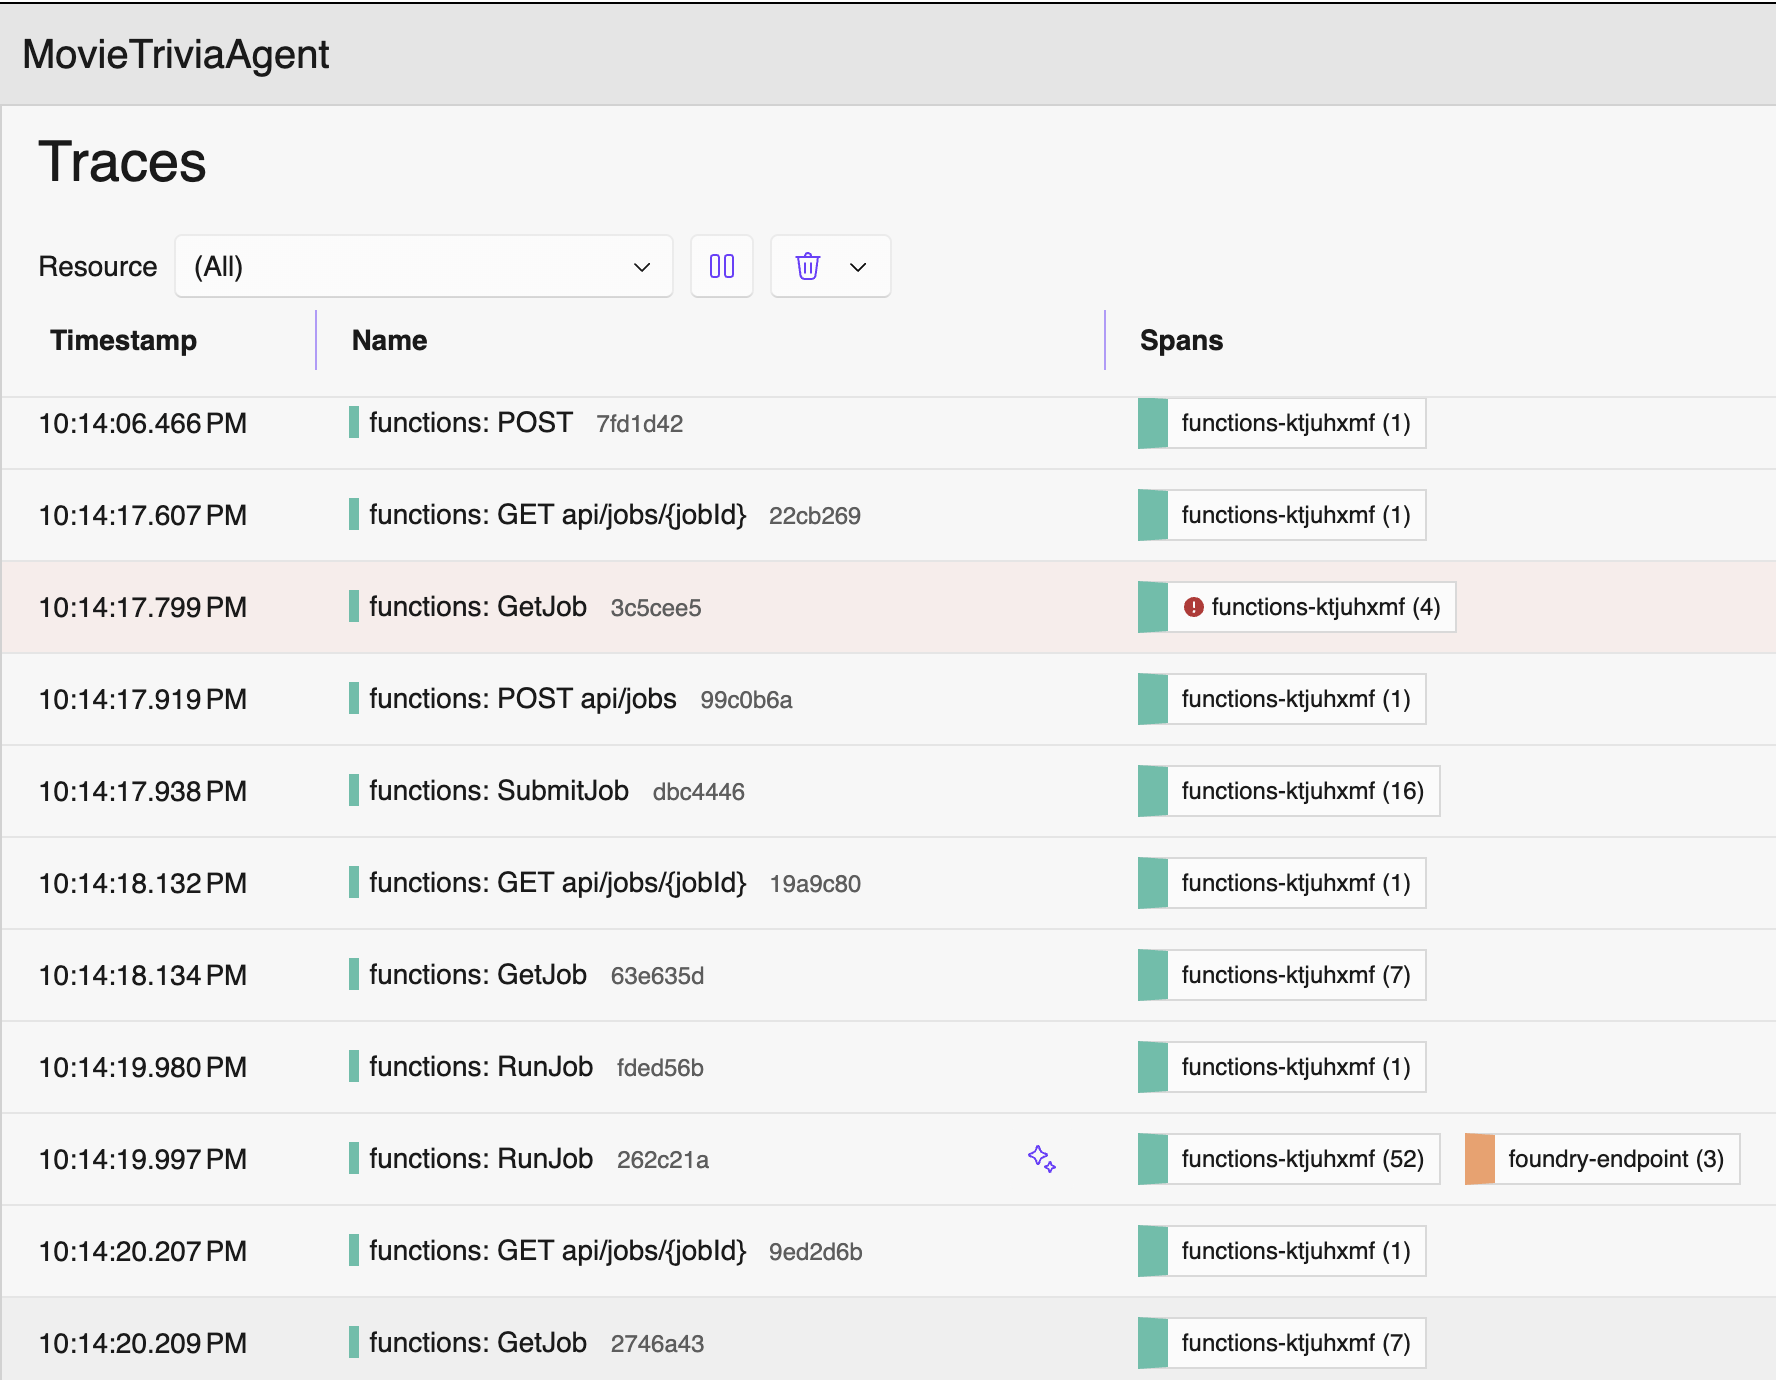
Due to an error in my demo prep, I ended up showing sparse OTel Traces – definitely not producing meaningful telemetry so observability will be subpar (or terrible). I am calling this the Anemic OTel Trace Antipattern. This antipattern comes through in the four screenshots that follow. The first screenshot shows the overall traces view listing one trace-per row. This is actually fine and normal as these are reasonable top-level traces. But drilling into any of these individual traces revealed no nesting and no context.
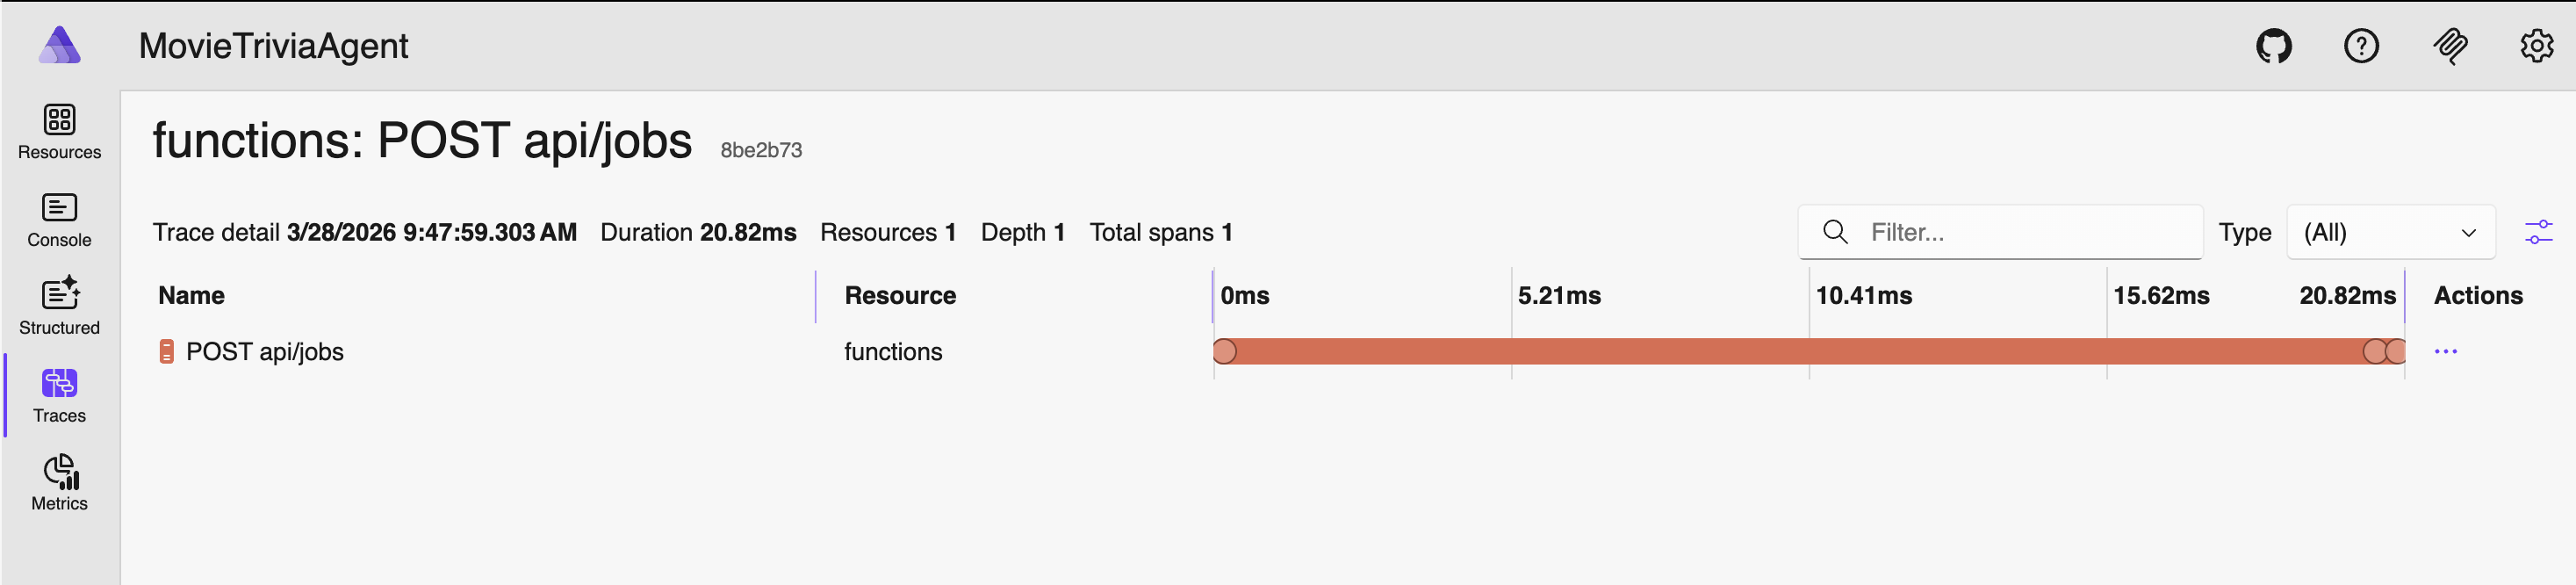
Click on “functions: POST api/jobs” trace – this is the detail after clicking on the one trace row
The Flat Trace OTel Trace Antipattern
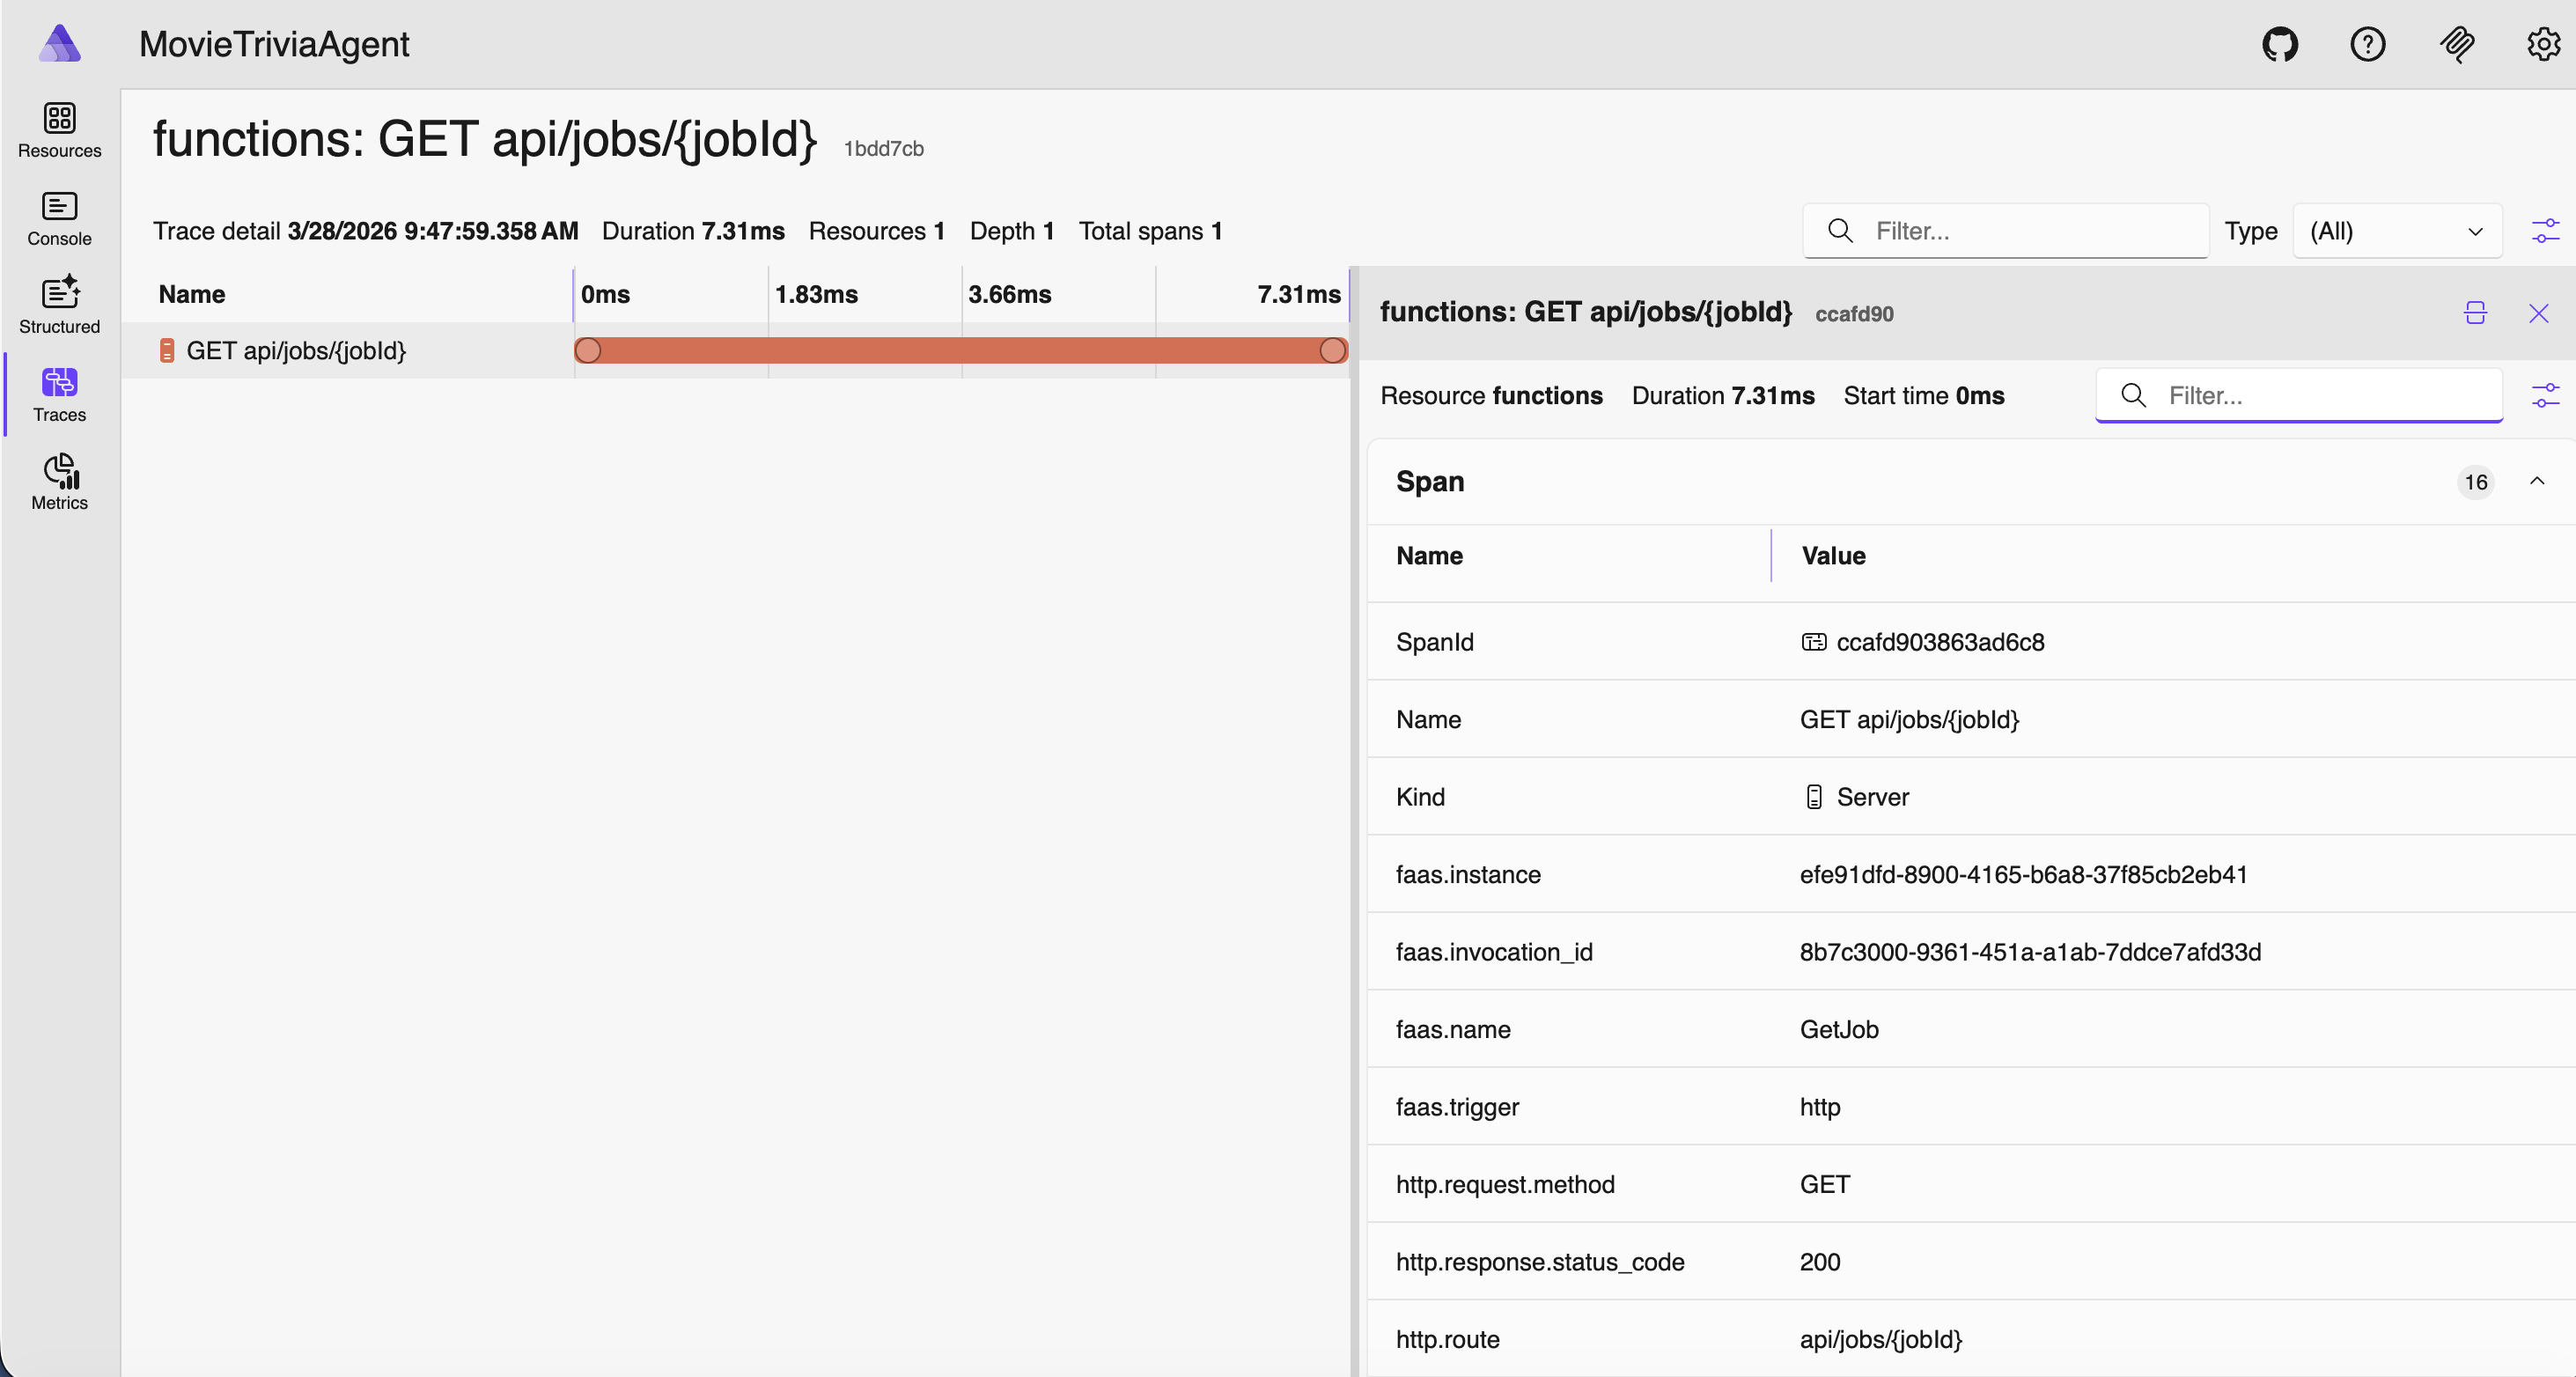
Consider the traces below. If GetJob is triggered by an HTTP GET to the jobs endpoint, then my suggestion is they should be nested – GetJob under the corresponding HTTP GET /jobs/guid. As shown below they are flat, appearing as siblings rather than hierarchical. This is another OTel Trace Antipattern – let’s call it the Flat Trace OTel Trace Antipattern. We have this great “Trace”/”Span” nesting support, but still our signals look like old-school flat log entries. Definitely not optimal!
Properly Nested Traces and Spans
Let’s tighten up terminology. An OTel Trace represents the complete journey of a request through a system, and it is made up of one or more Spans that form a (logically nested) tree where each span is a unit of work. Within a trace it can make sense that some spans are siblings and others nested – it should mimic the actual flow through the system. The tree is reconstructed by following parent_span_id references. A trace can span multiple services (distributed tracing for the win!). Each service creates its own spans, propagating the Trace ID and parent Span ID via context propagation headers (e.g., traceparent in W3C Trace Context). Each Span in a Trace will share the same trace_id but have its own unique span_id.
So, using our vocabulary from above, the remedy for Anemic is to add more spans, and the remedy for Flat is to reuse span parents – passing them down to child processes rather than creating new spans.
With proper span structure, here is the SAME application again, except with OTel Traces and Spans more thoughtfully configured.
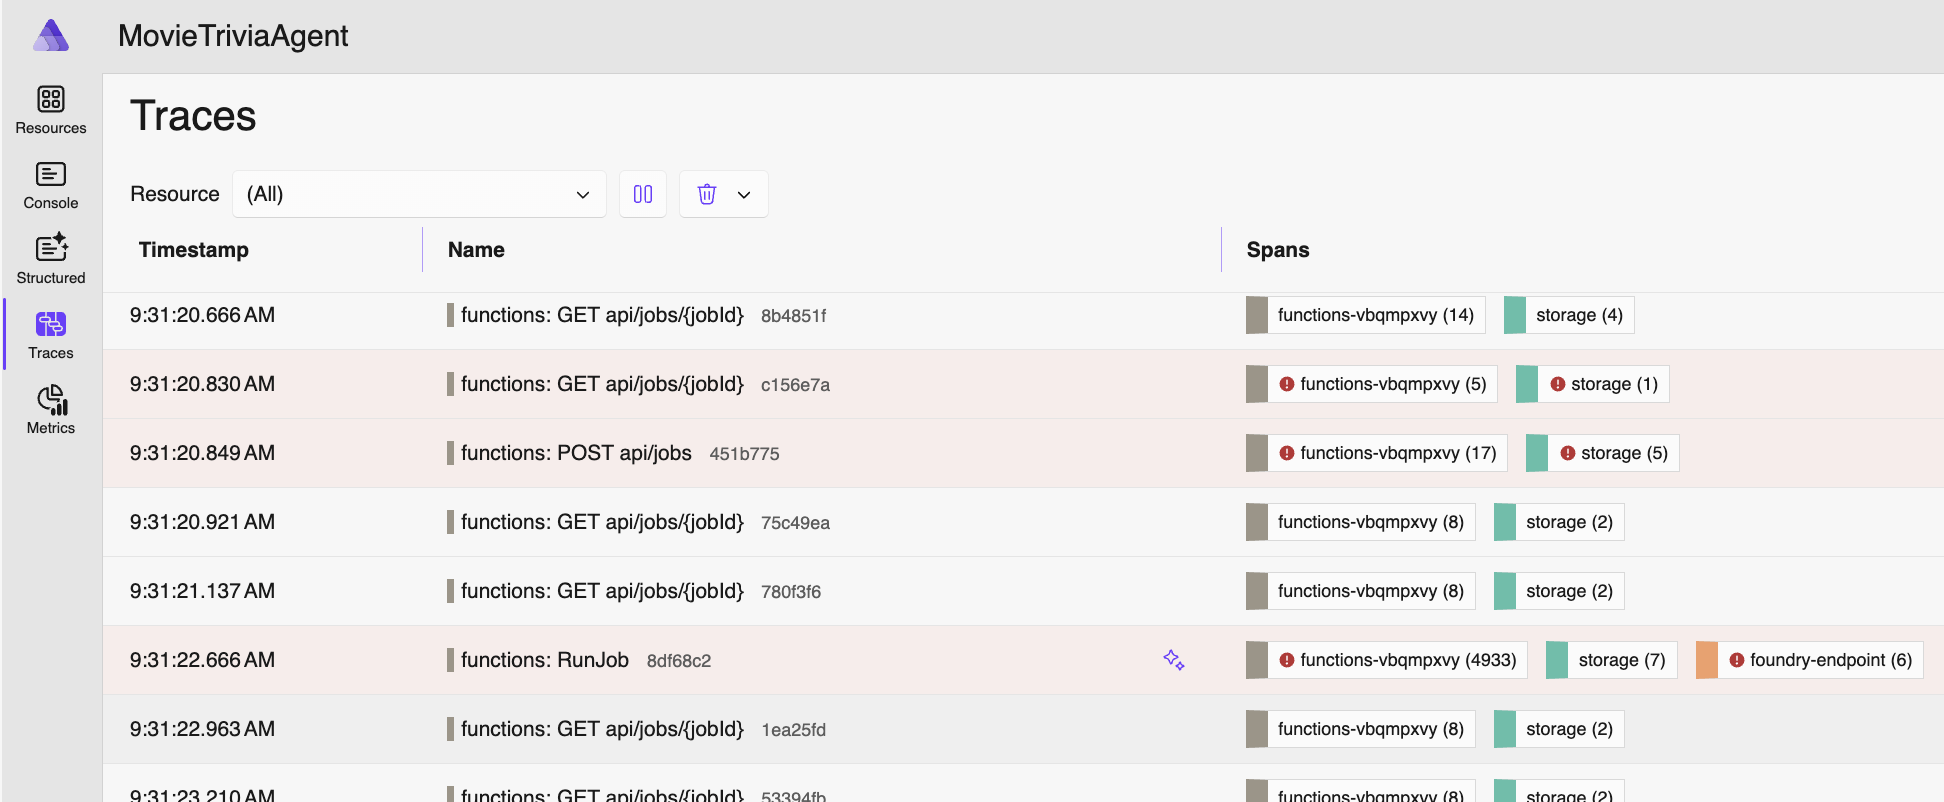
Now I can click on any of these and there will be spans nested within. You can tell the number and types of spans from the Spans column. The following span is from when the job was submitted: starts with an HTTP POST, stores some stuff in an Azure Storage Blob, creates a message in an Azure Storage Queue, then returns an HTTP 202 STATUS (“Accepted”) with a JobId.
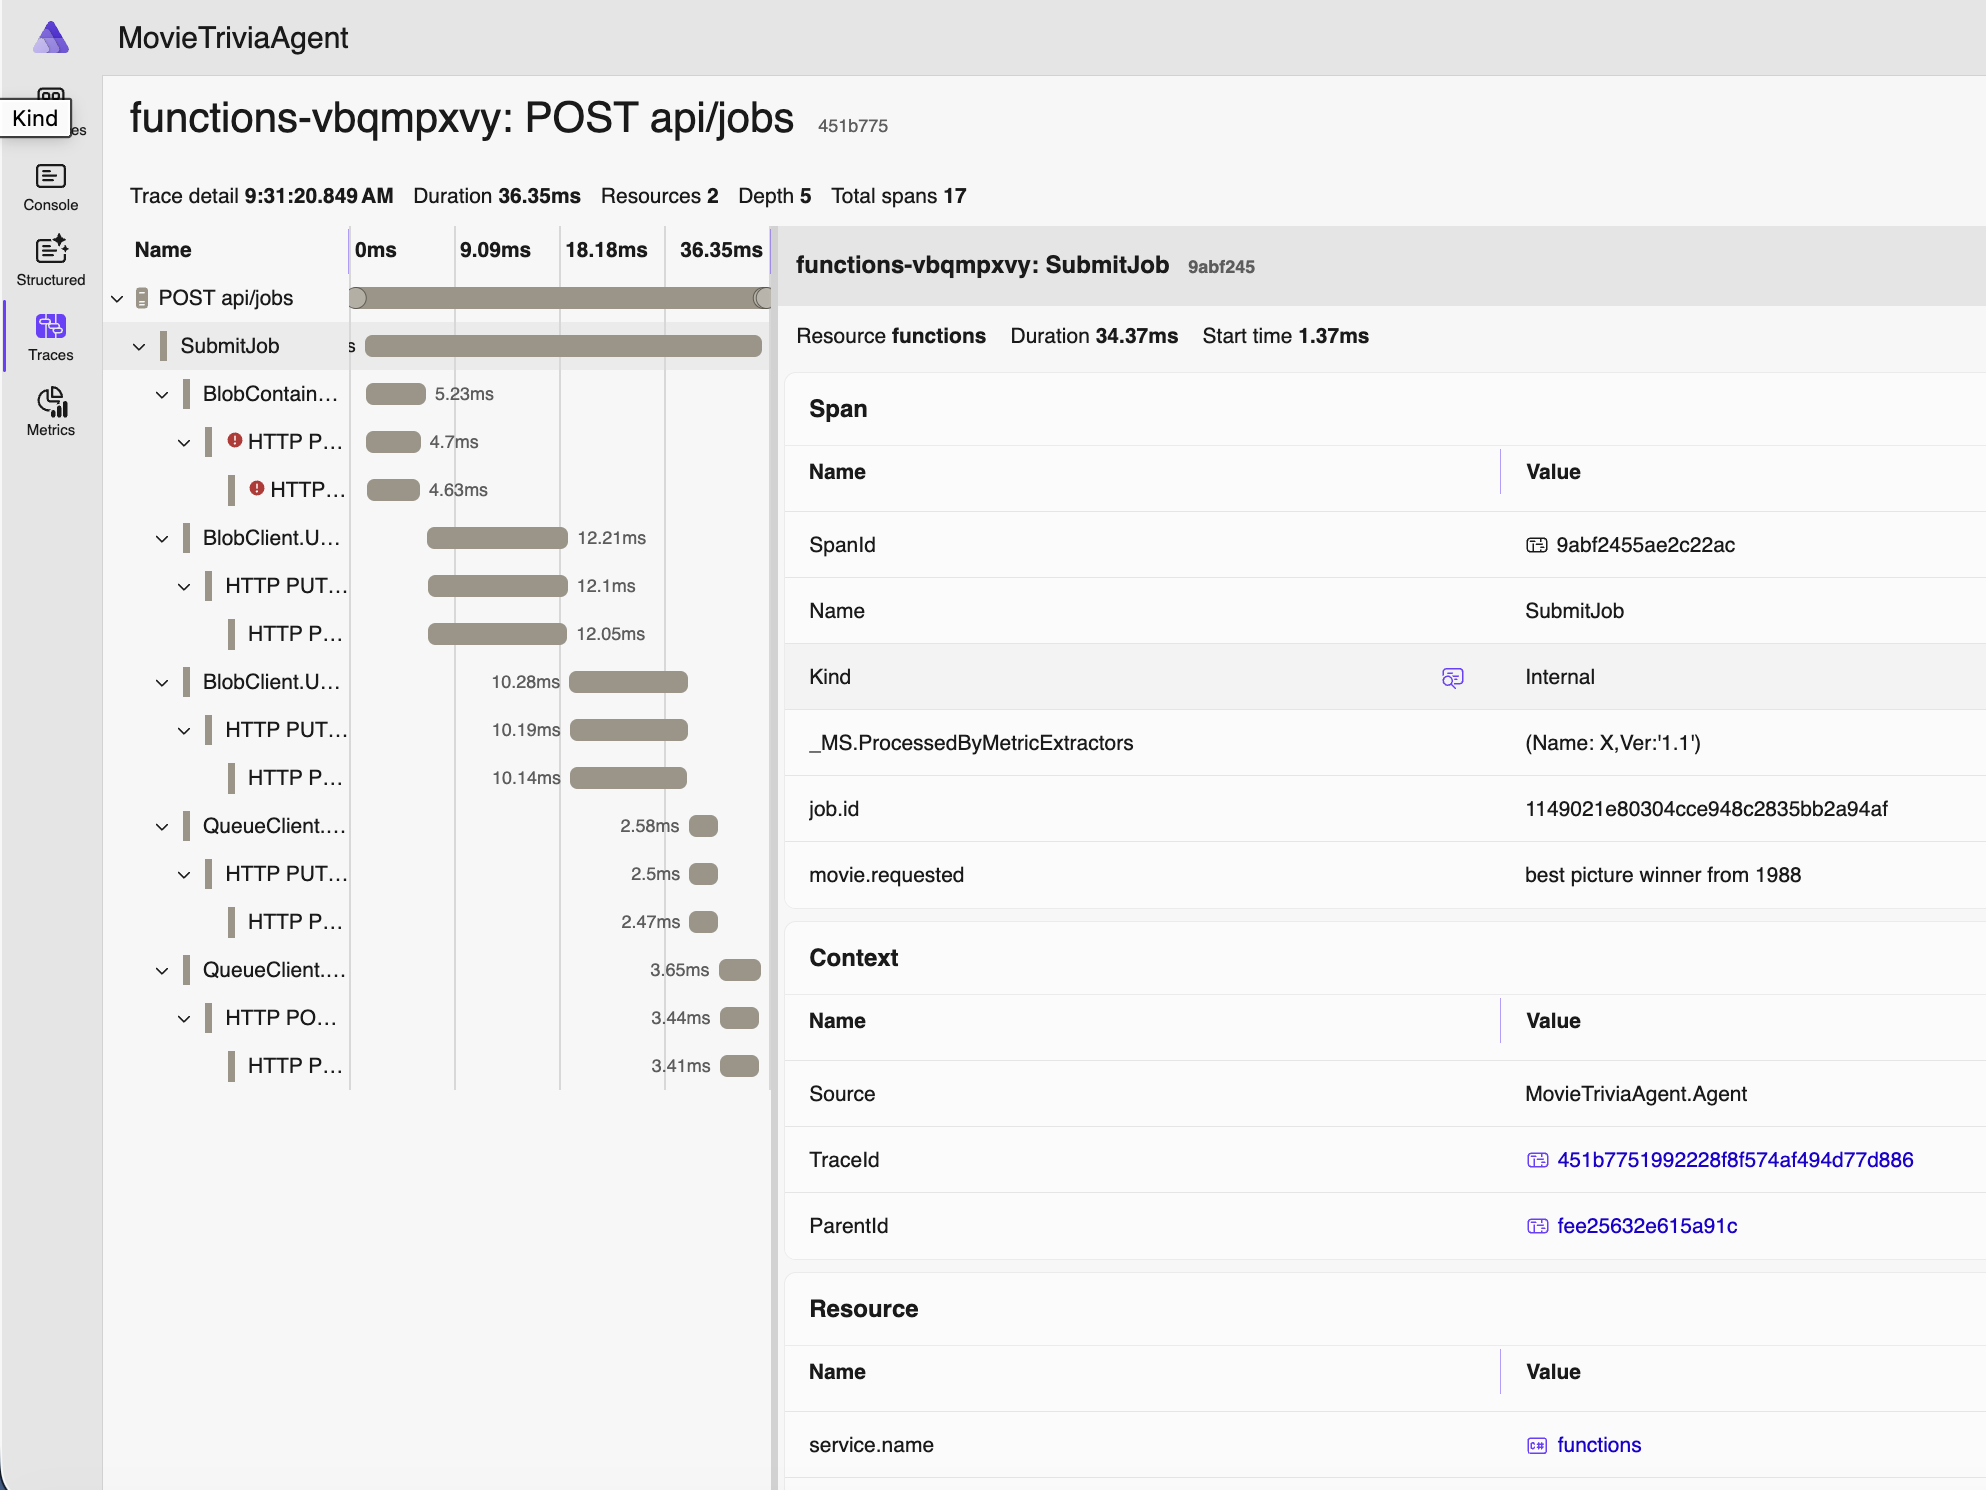
Note above that movie we are requesting to assess is “best picture winner from 1988” – which is not a movie name you’ll find on IMDB. But a human will at least know what you mean. As will an LLM.
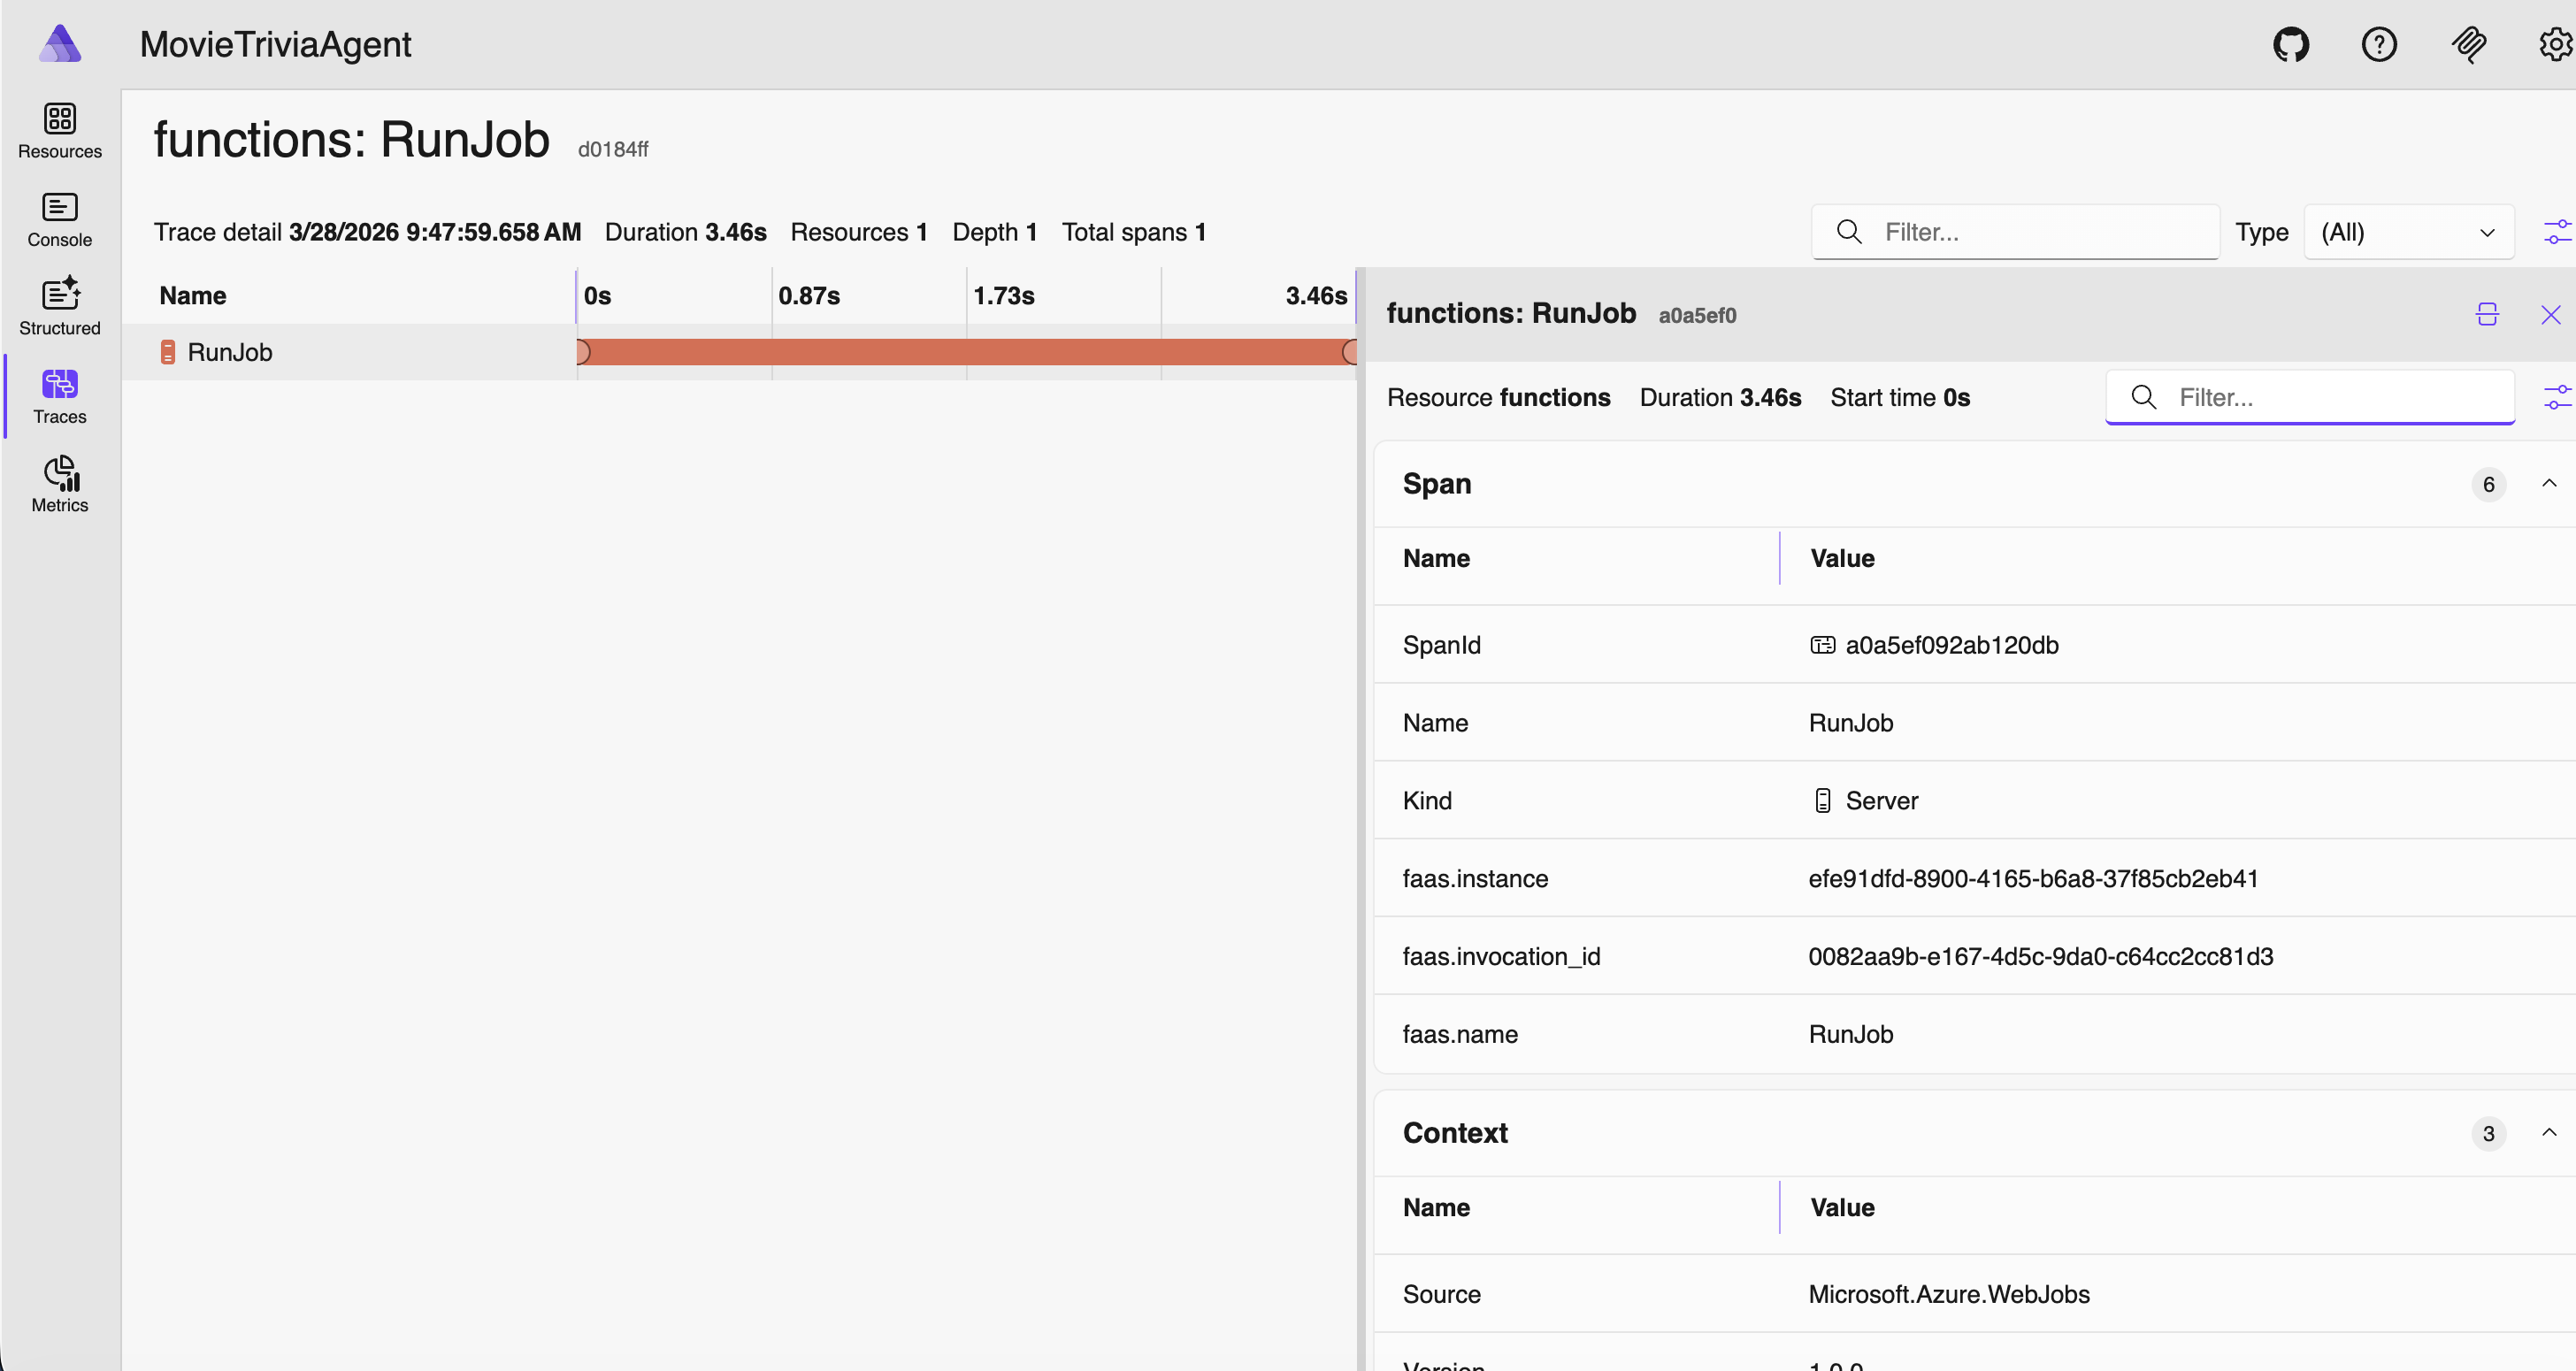
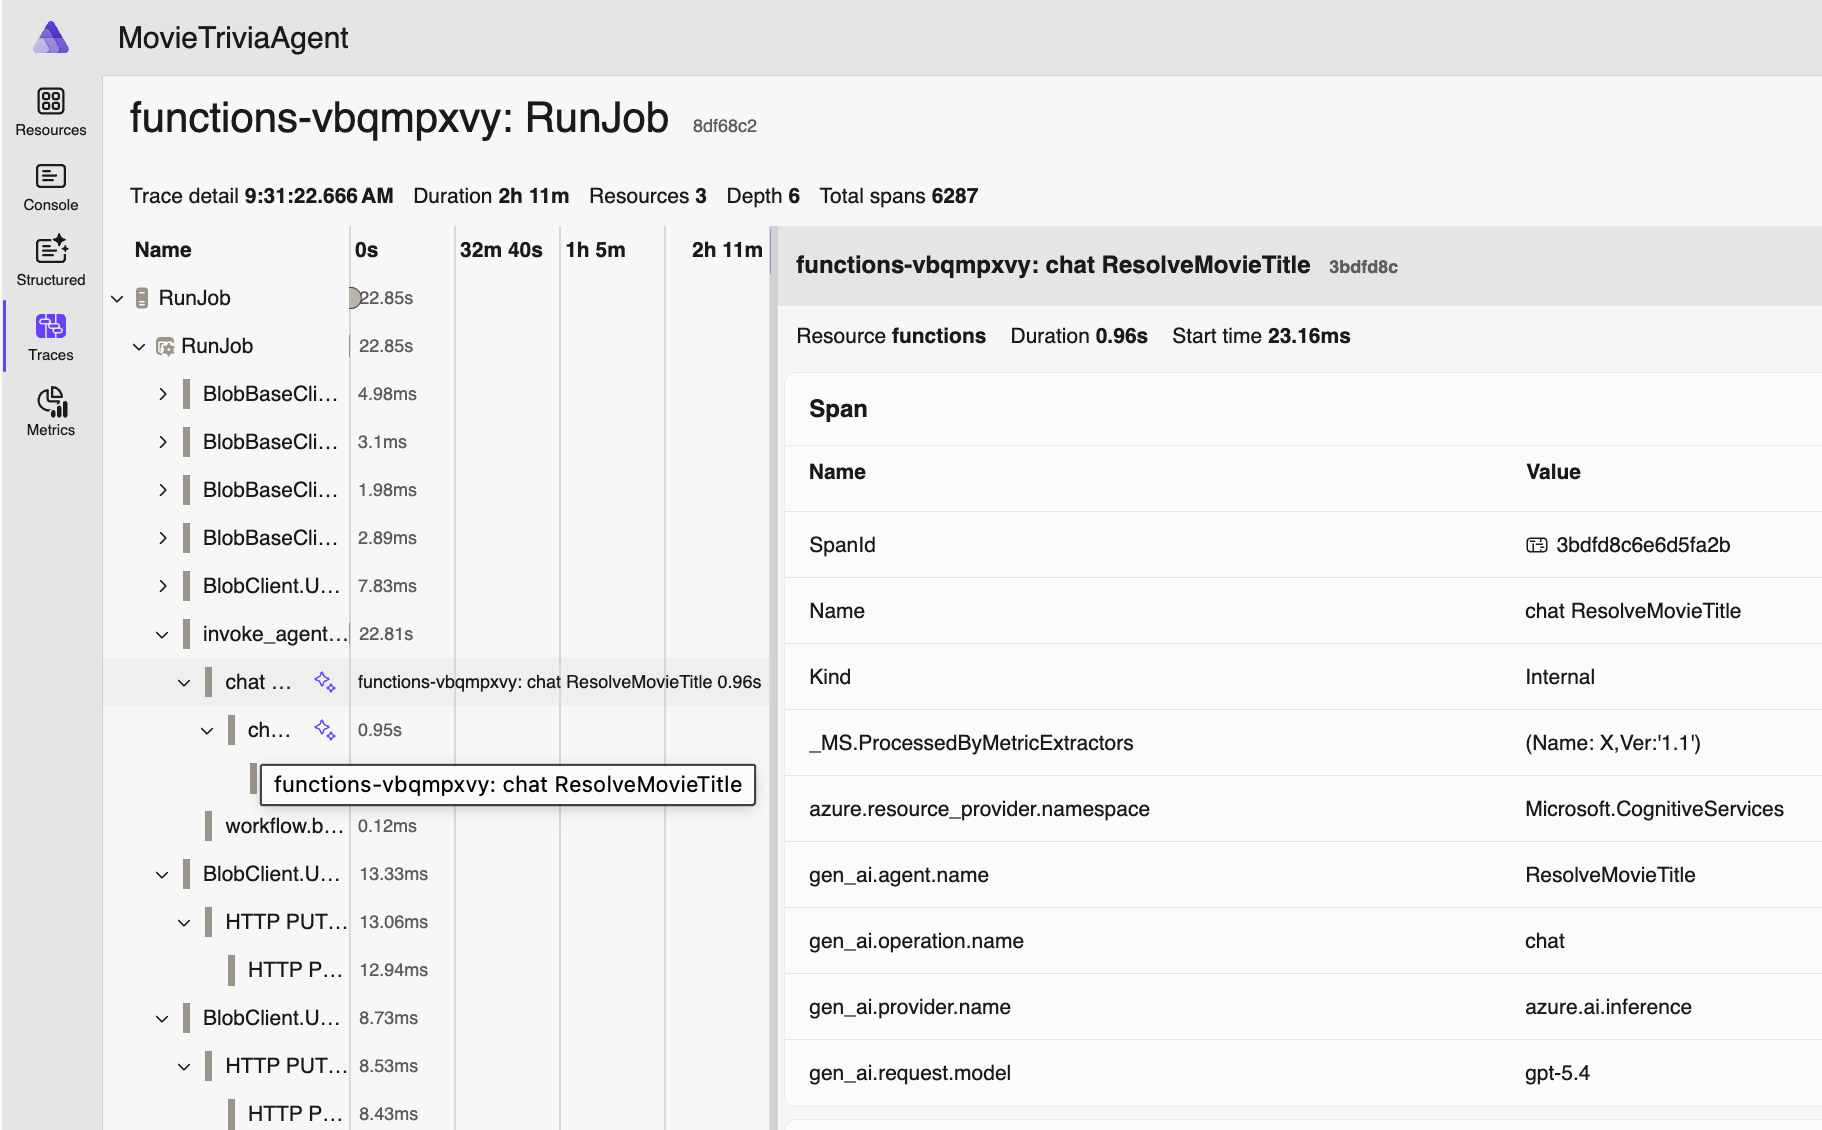
Now let’s double-click on the “RunJob” trace for the same movie – this is also around 20 seconds after the job was created since processing is asynchronous – and starts when our movie makes it to the front of the Azure Storage Queue queue:
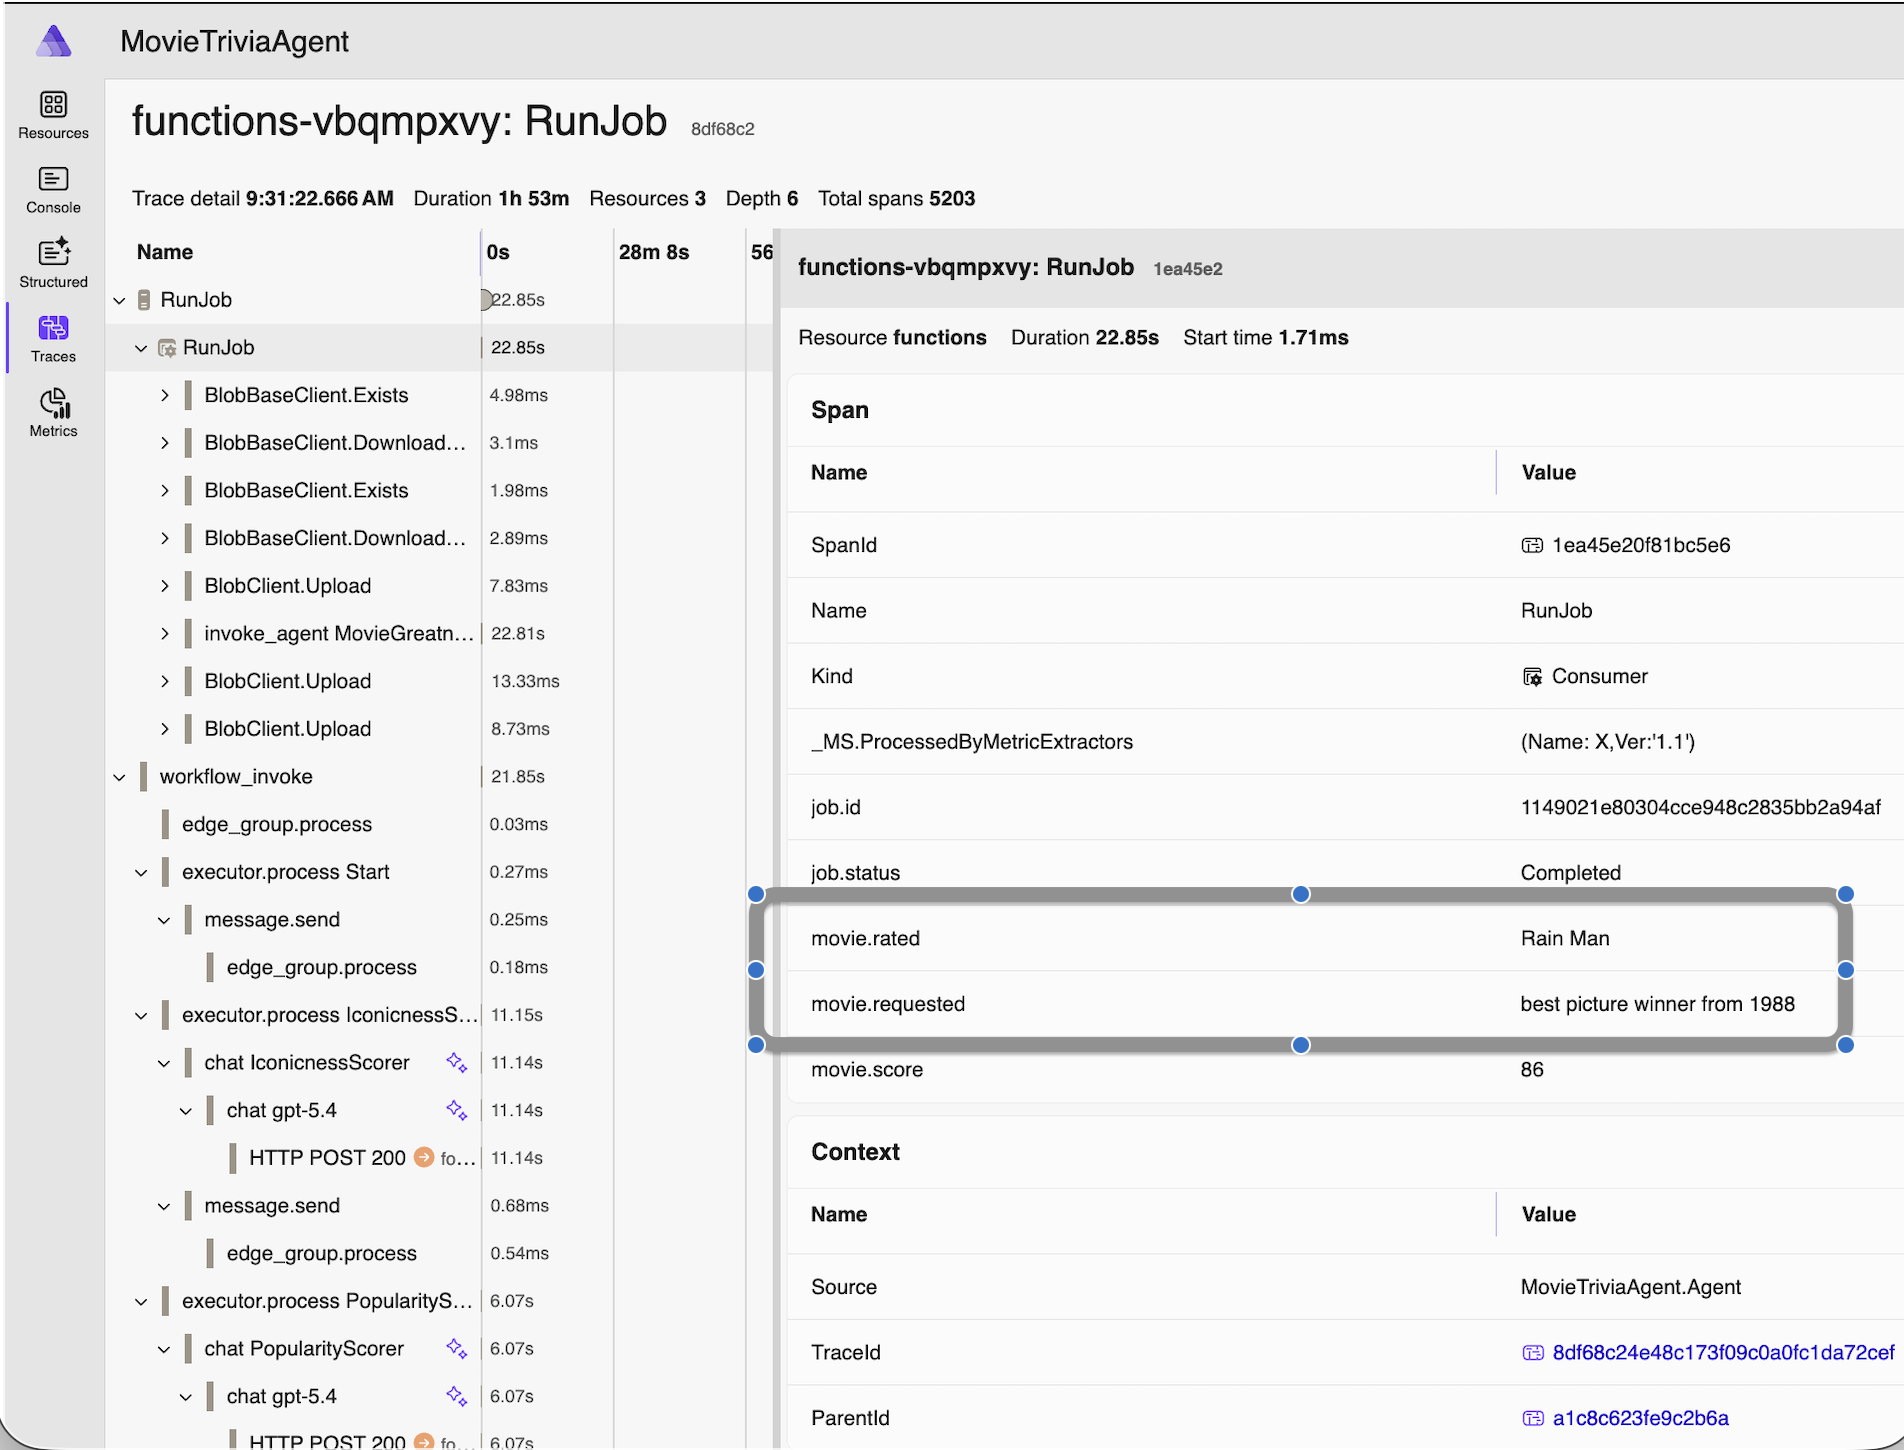
Since we have an AI Agent, the movie request we made earlier (via HTTP POST) was asking to assess “best picture winner from 1988” and the name of the movie actually assessed was “Rain Man” as you can see. AI is working for us. For visibility in our monitoring and debugging, we added those details as properties in the OTel span. The helps us know exactly which business operation we are looking at when we review the telemetry.
Here’s one more span from the RunJob trace, this one showing some OTel Semantic Conventions for GenAI – the gen_ai.request_model and other span properties – but see also the next section for more on this:
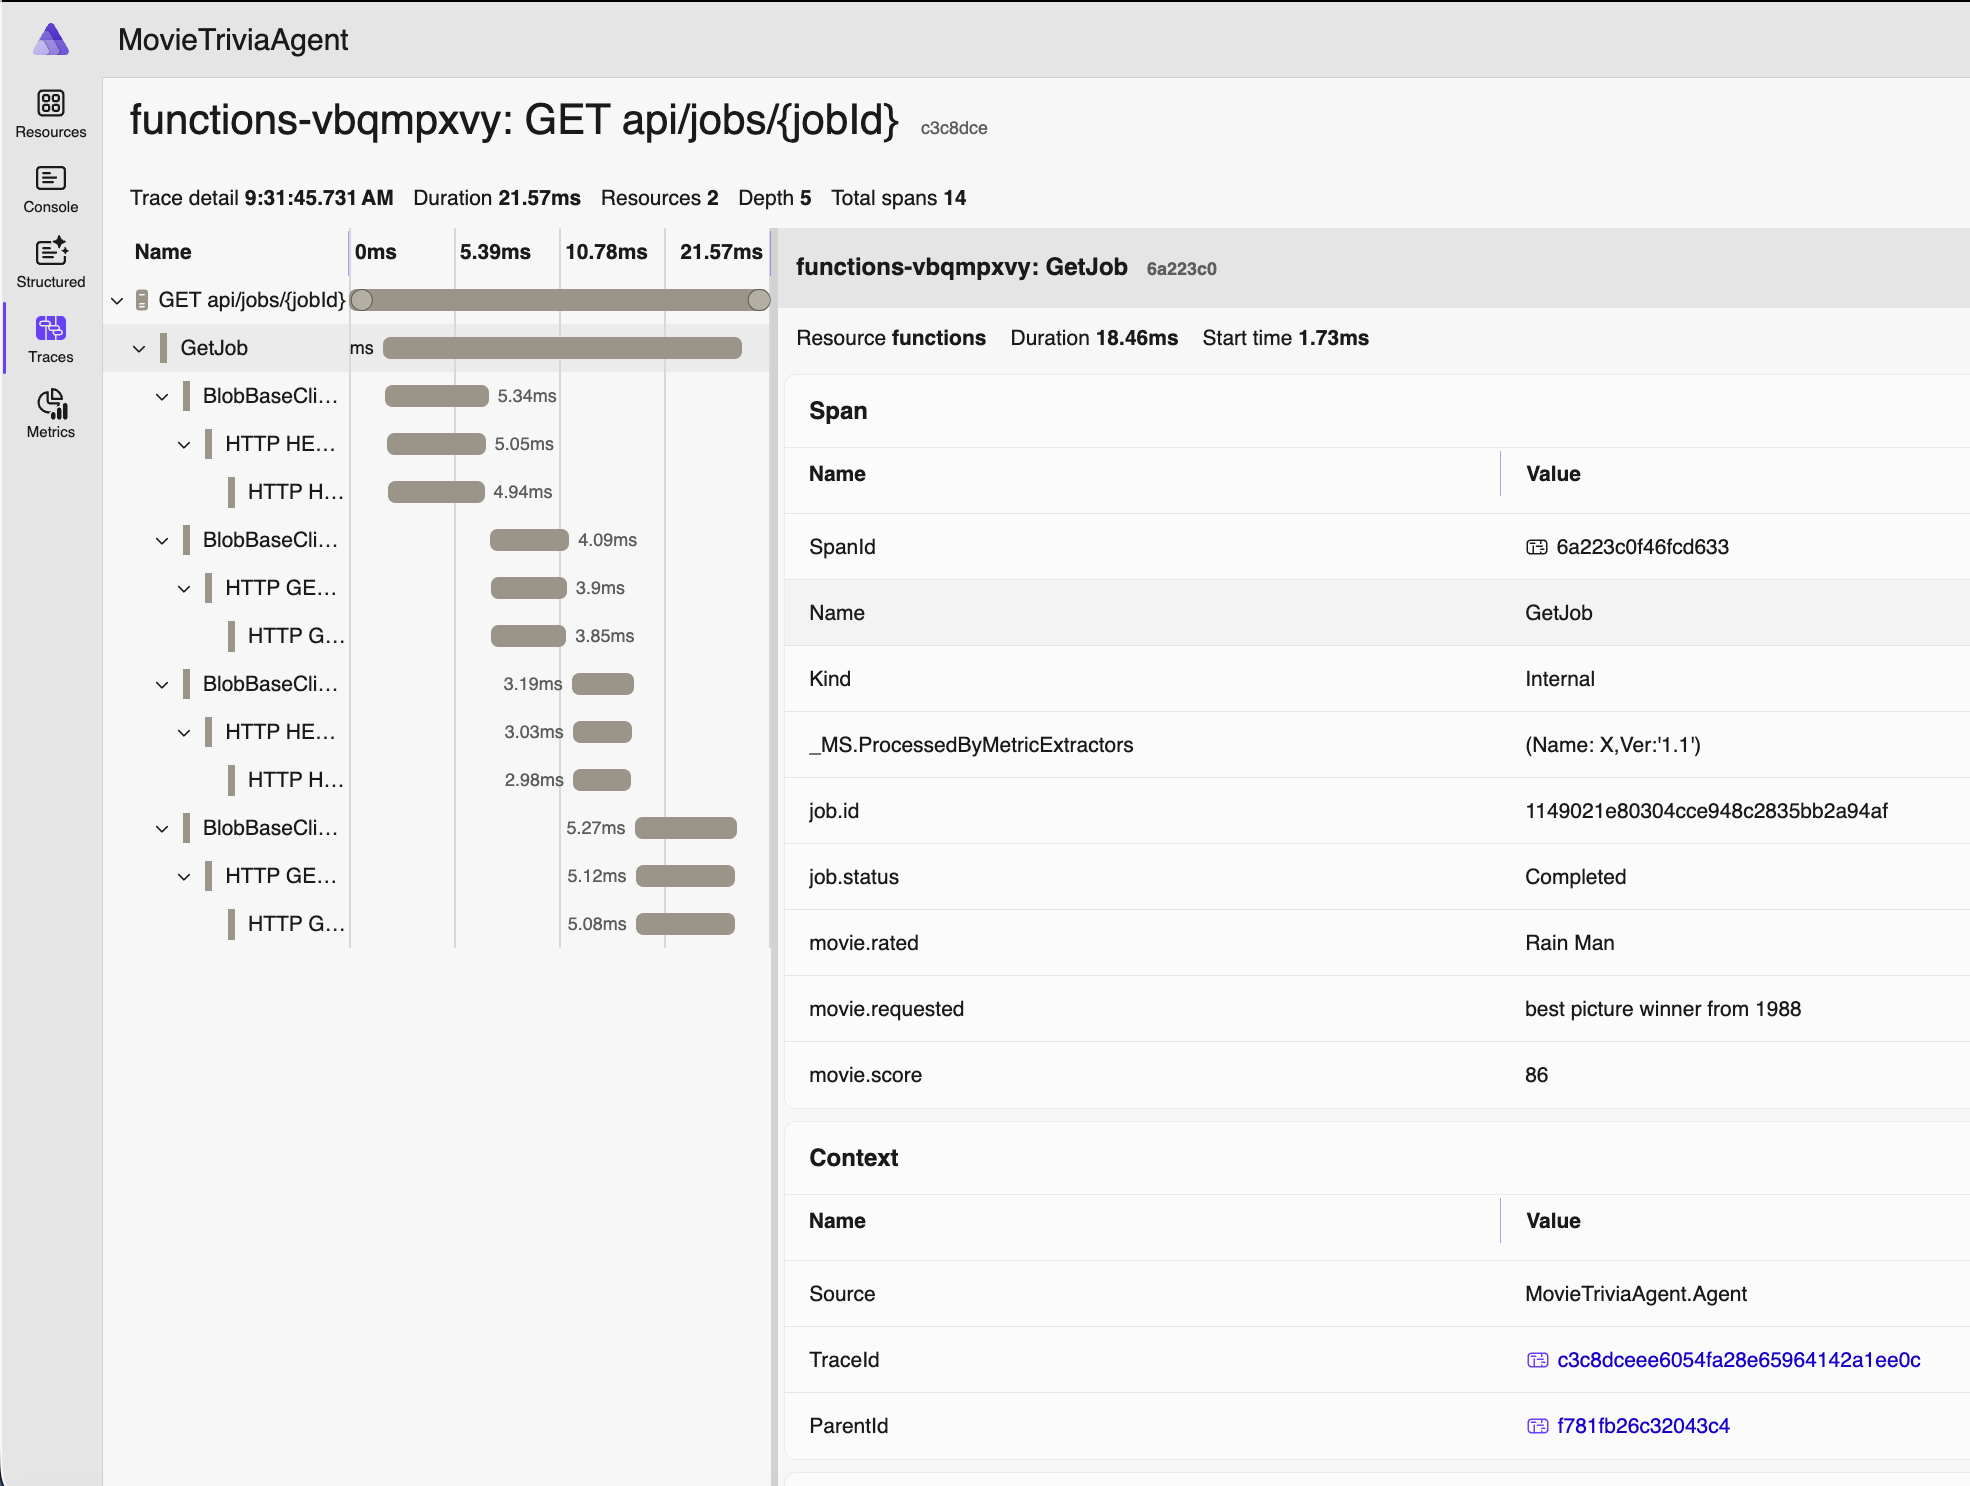
Finally, here’s the trace for that same movie request being retrieved after processing has completed:
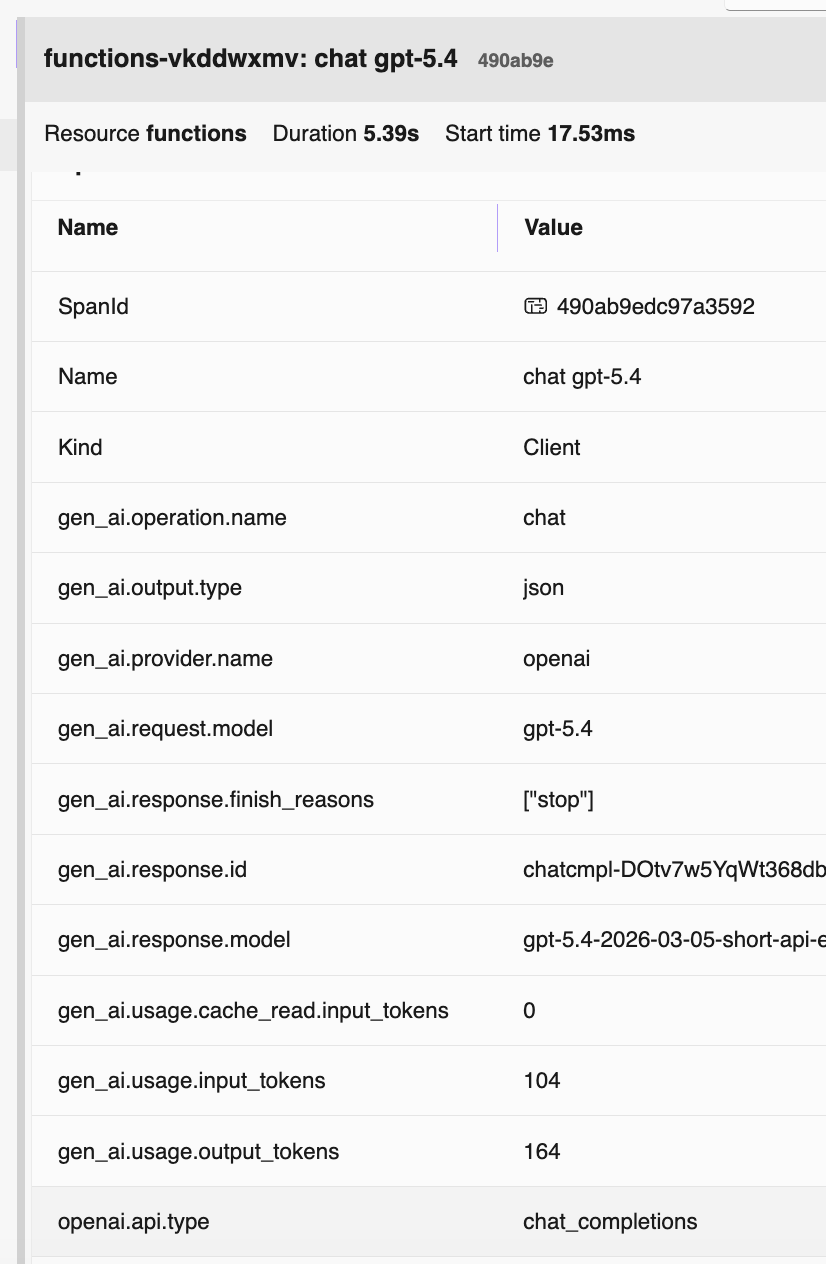
OTel GenAI Semantic Conventions
OTel drives consistency across solutions and vendors by specifying semantic conventions. Specifically for GenAI they specify many identifiers (see example above – two screenshots ago). In this screenshot you can see a bunch of them in action. For more information, check out these resources:
- https://opentelemetry.io/docs/specs/semconv/gen-ai/
- https://opentelemetry.io/docs/specs/semconv/gen-ai/azure-ai-inference/
- https://opentelemetry.io/docs/specs/semconv/gen-ai/mcp/
Source Code
- Repo is here: https://github.com/CrankingAI/goat-agent
Presentation
- PowerPoint Deck is here:

Pingback: Talk: Making Agents Work – Boston Code Camp #40 | Coding Out Loud